|
|
|
| Page Hits : 11154 |
|
 |
Mercantile Exchange Blog |
 |
 |
| |
Jun 5 2013 |
| Williams %R |
Williams %R is a tool used for the technical analysis in various commodities which was developed by Larry Williams in 1973. It looks very simple but is an effective momentum oscillator and has a very technical calculation procedure. It is a technical indicator that shows overbought and oversold which can give easy to interpret buy and sell signals.
Calculation
Typically, Williams %R indicator is calculated using 14 periods and can be used on various periodic basis- intraday, daily, weekly, monthly and yearly. However, the time frame and number of periods is subject to change on the grounds of desired sensitivity and attributes of individual security.
The scale ranges from 0 to 100 with readings from 0 to 20 is considered as overbought, and readings from (80) to (100) is considered as oversold.
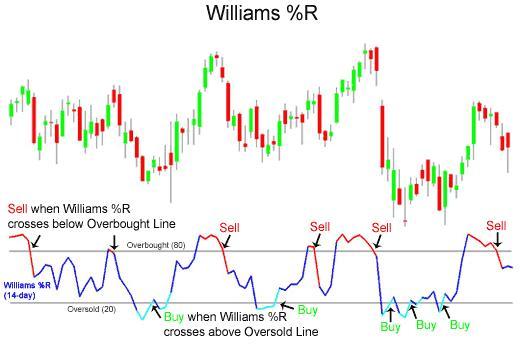
Buy Signal
Williams %R indicator reminds you of buy signal when the indicator is below the oversold line (20) and it rises to cross over the 20 line.
Sell Signal
Williams %R indicator reminds you of sell signal when the indicator is above the overbought line (80) and then falls below the 80 line.
There is no doubt that this technical analysis tool is very good with its trading attributes, however, it is suggested that a trader should not only depend on single technical analysis tool while trading.
|
|
|
| Posted by at 11:25:02 AM |
| -------------------------------------------------------------------------------------------------------------- |
|
| Leave a Reply |
 59 Visit(s) |
|
|
|
|
| |
0 Comment(s) |
|
|
Blog Home |
|
 |
|
|
 |
|
|
|
|
|


