Today, we would like to furnish details regarding the timing technique of the highly acclaimed pivot points. Without further adieu, we will explain the techniques, since the calculation part has already been touched upon in the previous blog.
Pivot point represents key levels where demand and supply meet. The prices of the respective commodity are driven by excessive demand and supply. High demand is synonymous with a bullish market whereas high supply is synonymous with a bearish market. When key levels are broken i.e. a support or a resistance level, the relationship between demand and supply are likely to change.
Support: A support is a pre-determined price level at which demand is strong enough to prevent the prices from declining further. The support level normally lies below the current price. When the prices move towards the support level buyers normally become more inclined to buy and sellers become less inclined to sell. When prices reach the support level, demand will overcome supply, thereby reversing the trend. An investor will take a long position in this situation as the prices will rise towards the pivot point. But if the prices breach the support level, then the investor is likely to take a short position, as the prices will normally move towards the second support level.
Resistance: A resistance is a pre-determined price level at which supply is strong enough to prevent the prices from rising further. The resistance level normally lies above the current price. When the prices move towards the resistance level sellers normally become more inclined to sell and buyers become less inclined to buy. When prices reach the resistance level, supply will overcome demand, thereby reversing the trend. An investor will take a short position in this situation as the prices will fall towards the pivot point. But if the prices breach the resistance level, then the investor is more likely to take a long position, as the prices will normally move towards the second resistance level.
The following crude oil chart illustrates the concept of the pivot points
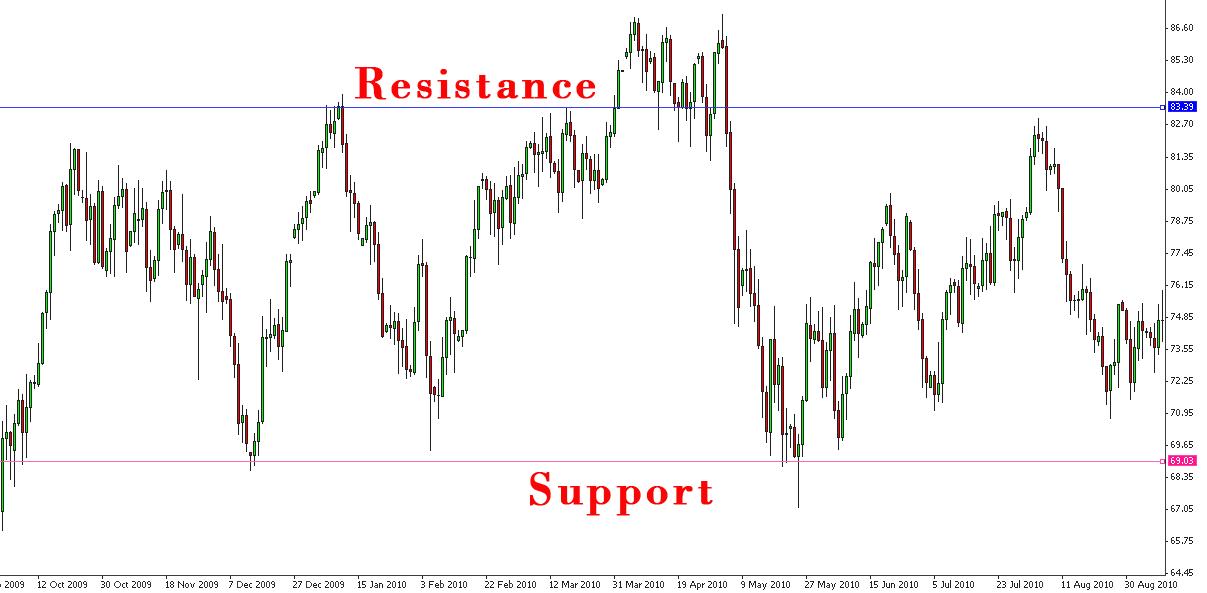
As we can observe from the above chart, crude oil prices had found a good support and resistance levels at USD 69.03 and USD 83.39 respectively from October 2009 to August 2010. The prices did move towards the respective support and resistance levels but upon reaching the levels it reversed towards the pivot point. The support and the resistance levels were strong enough in preventing the prices from breaking the levels. An exception case, was at the time of March 2010, when the prices did break the resistance levels, it increased towards the second resistance but was not strong enough to continue on its bullish trend ultimately reversing the market trend.
Hence, an investor trading with the assistance of the pivot points should carefully detect any divergence towards the support or resistance levels, to capitalize on any opportunities of gaining profit.
| 


 39 Visit(s)