|
|
|
| Page Hits : 11152 |
|
 |
Mercantile Exchange Blog |
 |
 |
| |
Nov 30 2012 |
| Regression Analysis- A Forecasting Tool! |
What is a Regression Equation?
A regression equation is a statistical tool i.e. used to determine the strengths of relations between one dependent variable and a series of independent variables.
Suppose we have one dependent variable Y i.e. influenced by a number of other independent variables X. Furthermore, let us suppose the relationship between y and x is linear, but the exact relation is not known though, then only the determination of x, y does not complete our task and we also have a random component µ to be discussed, which we call the disturbance or error. An error term refers to the unidentified or the unexplained variables affecting the dependent variable y.
Let i index the observations on the data pairs (x, y). Then the simple linear regression model looks like:
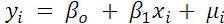
Where,  and and  represent the y-intercept and the slope of the line respectively. represent the y-intercept and the slope of the line respectively.  represents the random component which is called the error term, in general. represents the random component which is called the error term, in general.
Regression Analysis for the Production of Corn
Regression analysis happens to be probably the single most useful analytical tool in fundamental analysis. Let us suppose, the regression equation for the analysis of the above requirement looks like:

Where,
 = Production of Corn = Production of Corn
 = Y-intercept = Y-intercept
 = slope/coefficient of = slope/coefficient of  where where  = Area of wheat cultivation = Area of wheat cultivation
 = slope/coefficient of = slope/coefficient of  where where  = Availability of Fertilizer = Availability of Fertilizer
 = slope/coefficient of = slope/coefficient of  where where  = Availability of Irrigation Facility; and = Availability of Irrigation Facility; and
 = Error Term = Error Term
|
Model |
Unstandardized Coefficients |
|
B |
Std. Error |
|
(Constant) |
41.401 |
12.186 |
|
Land Area of Corn Cultivation (In Hectares) |
.222 |
.022 |
|
Availability of Fertilizer |
.353 |
0.045 |
|
Availability of Irrigation Facility |
1.732 |
0.001 |
(All data above are hypothetical figures)
Analysis:
This is an example of partial sample result chart that we may obtain after we carry out the regression from statistical software, SPSS (Statistical Package for Social Sciences). The interpretation goes like this. Since, all the three factors have positive relation with the production of the corn, and their significance is revealed by the std. error coefficients which should be less than 0.05 for its significant effect; the further relation between production and price is driven by a basic economic principle: Higher the production, lower will be the price. Thus, we can see that per unit greater the use of land (in hectares) can increase the production of corn by 0.222 times and help decrease the price. Similarly, availability of fertilizers can increase the production by 0.353 times and the most of all, availability of the irrigation facility can increase the production by 1.732 times. From the above result, the decrease in price will also be accompanied like; the price will be decreased most by the use of irrigation in production, followed by availability of fertilizers and the use of greater land simultaneously. Moreover, we can also determine the importance of irrigation facility for the corn production.
This is how the analysis can be done for every commodity from the past data and trend available and we can forecast the future price. But, one of the most considerable factors is that right variables should be chosen or else the regression analysis is of no worth. And, finding the right variables becomes easier when we go through the past trend and identify the major variables affecting the price of the corn.
Note: This blog is just an expression of the authors opinion and cannot be deemed responsible for any losses incurred.
|
|
|
| Posted by at 2:26:38 PM |
| -------------------------------------------------------------------------------------------------------------- |
|
| Leave a Reply |
 31 Visit(s) |
|
|
|
|
| |
0 Comment(s) |
|
|
Blog Home |
|
 |
|
|
 |
|
|
|
|
|


