Pivot point is an average of significant prices (high, low, and close) from the performance of a market in the prior trading period. Generally, if the market goes above the pivot point, it is usually considered as a bullish trend, where as the trend below the pivot point is taken as bearish trend.
Pivot points are especially useful to short term traders who want to take advantage of small price movements. Like other technical tools, pivot point also draws support and resistance level, using which traders choose to trade on the bounce or the break of these levels. In the figure below, PP signifies Pivot point, S signifies Support, and R signifies Resistance level.
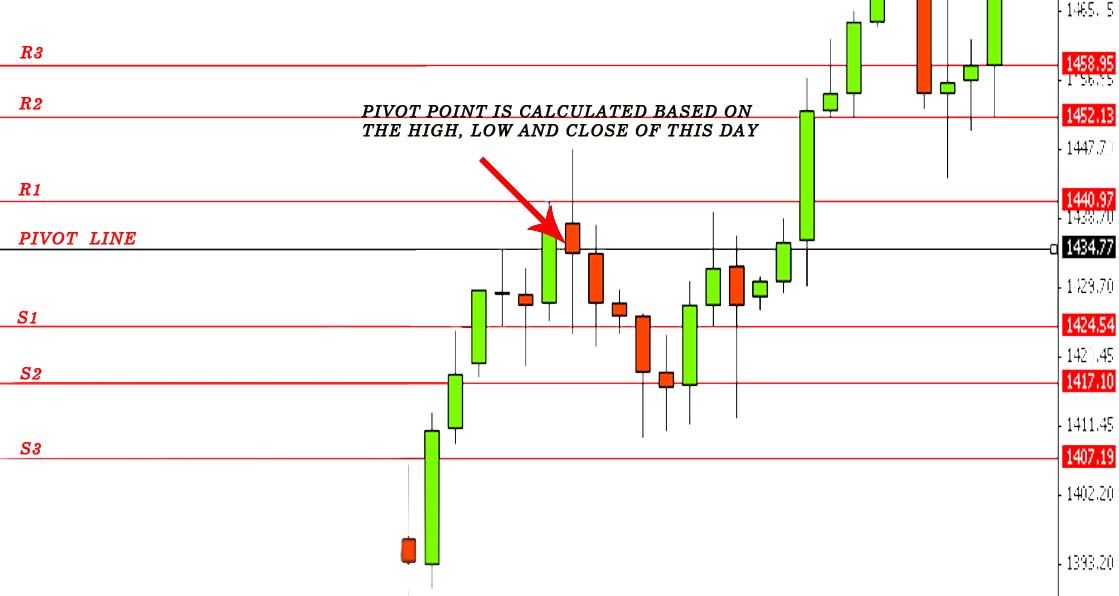
Now lets talk about how to calculate pivot points. The pivot point and required support and resistance are calculated by taking the high, low, and close prices of last trading session. Though pivot point calculator is offered by many websites. It is important to know the exact formula for calculating pivot point, support and resistance.
The calculation for a pivot point is shown below:
Pivot point (PP) = (High + Low + Close) / 3
Likewise, support and resistance levels are calculated using following:
First Resistance (R1) = (2*PP) Low
First Support (S1) = (2*PP) High
Second level of support and resistance:
Second Resistance (R2) = PP + (High Low)
Second Support (S2) = PP- (High Low)
Third level of support and resistance:
Third Resistance (R3) = High + 2(PP- Low)
Third Support (S3) = Low 2 (High PP)
The pivot point calculator that weve mentioned in the earlier section can be obtained from http://www.pivotpointcalculator.com/ . These calculated levels often act as turning points for the direction of price movement in a market. In an up-trending market, the pivot point and the resistance levels may represent a ceiling level in price above which the uptrend is no longer sustainable and a reversal may occur. In a declining market, a pivot point and the support levels may represent a low price level of stability or a resistance to further decline.
This is only the basic introduction of Pivot Point and we will be explaining about the trading techniques and strategies the pivot point suggests for trading in our coming series, so dont forget to follow our blog tomorrow.
| 


 201 Visit(s)