The Elliot wave theory was propounded by Ralph Nelson Elliot but was popularized much later by Robert Prechter. Elliot closely analyzed 75 years worth of stock data and discovered that stock markets, believed to behave in a chaotic situation, actually didnt. This theory explains that crowd behavior flows in clear trends. He published his theory in the book entitled, The Wave Principle, in which he pointed out that the markets traded in repetitive cycles, which were the emotions of investors caused by outside influences and the psychology of the masses at the time.
Elliot explained that the same repetitive patterns in the upward and downward swings in price were caused by the collective psychology. He named these upward and downward swings as waves. Identifying the repeating patterns in prices will help the investors to predict where prices will go next. This aspect of the Elliot waves was extremely appealing to the traders as it gave them a way to identify precise points where prices were likely to reverse.
Impulse Wave Pattern:
The first 5-wave pattern is called the impulse wave which is shown in the following diagram.
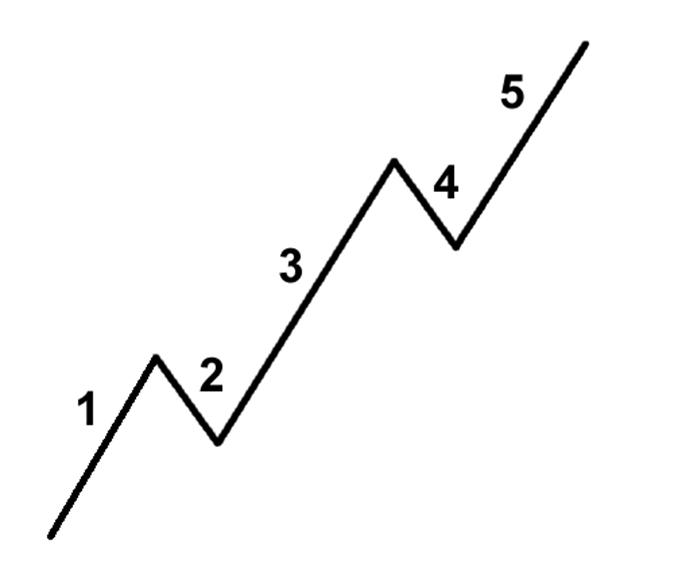
In this pattern, Waves 1, 3 and 5 are motive waves, meaning they go along with the overall trend while Waves 2 and 4 are corrective waves. Now lets understand the explanation of each wave.
Wave 1: The respective market moves up due to the fact that a small number of people feel that the price is quite cheap, so they think its a perfect time to buy
Wave 2: Here, people who had taken a long position, feel that the security is overvalued and offset their positions. This causes the price to fall but not to the previous low as it will be considered a bargain again.
Wave 3: This is usually the longest and the strongest as the security has caught the attention of the masses and more investors have started taking long positions. This wave usually exceeds the high created at the end of Wave 1.
Wave 4: Traders book profits as the security is considered over-bought again. This wave is normally weak because there are usually more people that are still bullish on the security and are waiting for an opportunity to buy again.
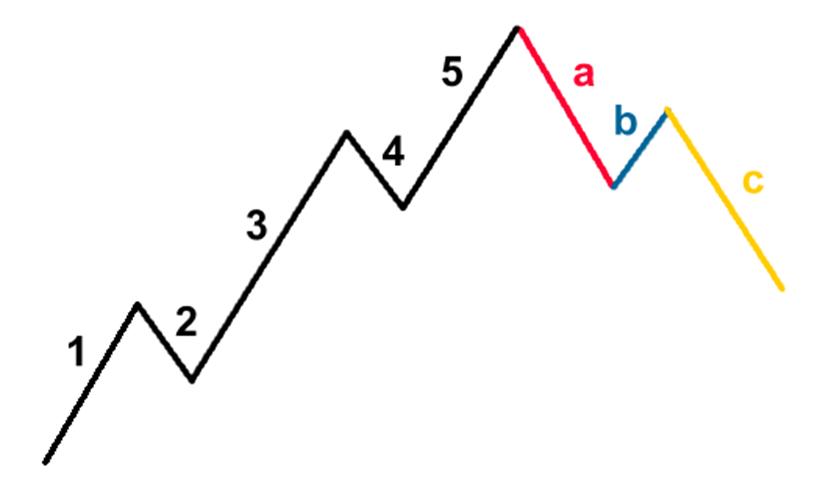
Wave 5: This is the wave which is mostly driven by people and sometimes over-hyped media coverage which suddenly enhances the prices. This is when the security becomes the most overpriced and signals the beginning of the ABC pattern.
ABC Correction Pattern:
The 5-wave trends are then corrected and reversed by the 3-wave countertrends.
We will be explaining about the 3 major ABC patterns in our next article as well as how to ride the Elliots wave. In conclusion, we would like to furnish details regarding the 3 cardinal rules of the Elliot Wave.
Rule 1: Wave 3 can never be the shortest impulse wave
Rule 2: Wave 2 can never go beyond the start (low) of Wave 1
Rule 3: Wave 4 can never cross in the same price area as Wave 1
| 


 41 Visit(s)